4 Things You Need To Include In A Great Win-Loss Report
According to PWC, “73% of all people point to customer experience as an important factor in their purchasing decisions.” 🤯
Improving your customer’s experience is a massive sales opportunity.
But it’s not easy to see your product experience with fresh eyes when you’ve been head down in the product for months or even years. It’s near impossible to identify the hidden pitfalls that might exist in your UI or onboarding if you already know how a product is supposed to work.
The challenge is that most prospects never become customers. Prospects quietly disappear from the buying process, leaving you high and dry without any idea what went wrong.
Finding the answer to meaningful improvements is pretty simple: Send a win and loss request for feedback to customers and prospects.
By conducting win-loss interviews, surveys, drawing insights, and creating a win-loss report, you can find the quantitative information you need to hit next quarter’s goals and provide sales and marketing teams with clear-cut direction for their next move.
We regularly create win-loss reports that help businesses find out why they’re keeping or losing customers. This article condenses 10+ years of experience into one guide that helps you:
- Know what stats to include and why.
- Turn interviews into data that everyone can digest.
- Make your findings relevant to your business.
- Show others how to action insights.
The hidden superpower of a win loss report
Many opinions fly around your average strategy meeting. And depending on your company structure, it’s easy for two or more departments to be at odds with each other.
A typical scenario we’ve seen goes something like this:
A product has several cool features, but one or two are misunderstood, and it’s impacting the overall win rate. Sales reps think a feature is useless and should be axed. And it’s a fair point; customers’ eyes glaze over with confusion whenever the feature is mentioned in a demo.
On the other hand, marketing thinks they’re positioning the feature perfectly and that the sales team needs to explain it better. Que interdepartmental drama.
Meanwhile, the product devs are slowly going crazy because no one’s “getting” the real reason why they created the feature in the first place. If everyone listens, they know the feature will be a winner.
This opinionated tug-of-war can quickly sour a team and stall progress. It’s a product management nightmare. But customer interviews can help resolve it. Here’s how.
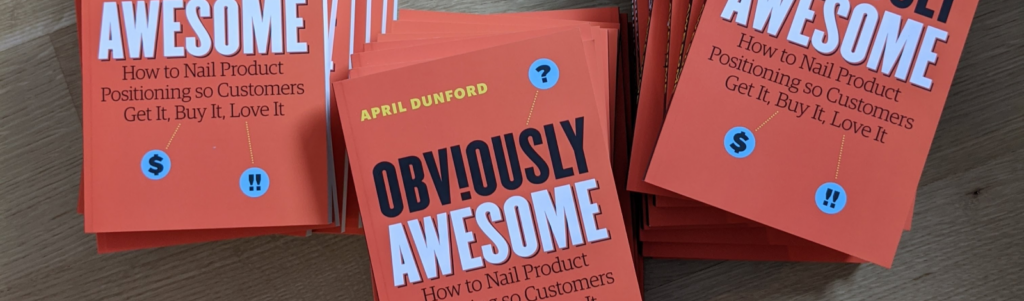
In April Dunford’s book on product positioning, Obviously Awesome, she explains a similar scenario: A product is unpopular with customers, and no one knows why. A young April desperately starts phoning customers and soon finds two groups of people:
- A vast majority think the product is useless.
- A tiny minority of super fans who’re using the product for something totally different from its advertised purpose.
Long story short, she convinced her bosses to re-do the messaging, and BOOM! The product was an instant success. Often, the answers to difficult questions can be found in your customer’s minds.
So, when looking for answers to your customer’s behavior, don’t speculate — asking them directly will yield more powerful results.
The hidden superpower of a great win-loss report is to unite departments, employees, and leadership around a shared understanding of your customers.
When everyone knows what your best-fit customers are doing, thinking, and feeling, you spend less time stuck in strategy meetings and more time being excellent at your job.
4 Best practices for win-loss reports
With any win-loss report, you’re looking to accurately convey the most relevant findings of your analysis, propose clear next steps for all stakeholders and improve your current KPIs.
1. Include numbers and statistics
Statistics are the best way to help people put your report in context and are one of the first things you want to include before you jump into findings from interview analysis.
Include these statistics in your win-loss report:
- Number of interviews/surveys conducted
- Prospect source (such as lost demos, churned customers, etc.).
- The response rate you received from sending out a request form to customers
- Demographic information for all research participants.
- Total win rate and loss statement for the recent sales cycle, including a win-loss ratio. Include:
- Percentages and hard numbers.
- The dollar value of the wins vs. losses.
- The competitive win rate if you have the data available.
- Current conversion rates for identified KPIs.
- A recap of loss reasons or loss analyses and other quantitative data you might have gathered.
- Highlight additional problem areas through statistics. You don’t need to solve the problem; you need to provide the context that it exists.
- Sales only converted 30% of attended demos.
- Observed an 80% drop off from free to paid.
- acquisition dropped by 15% in Q3.
- Support can’t resolve 50% of help requests.
These numbers will help the readers and recipients of your report fully understand the current landscape. For a product manager, this means those you work with will be more inclined to understand and therefore trust your recommended course of action.
2. Outline key themes
Put customer responses into theme buckets to quickly identify trends in your qualitative data and communicate them to others.
For example, let’s say you’ve asked a group of lost customers the same question “What was the main factor that led you to choose a different product?”
You can grab a handful of quotes from your recorded transcripts from each customer. A sample of those might look like this:
- “The other product was simple to set up; that made the difference for me.”
- “I felt like your product was a little too simple for the number of tasks I need it to perform.”
- “I couldn’t perform a vital function in your product.”
- “I didn’t find a feature I was looking for despite it being advertised in the demo call.”
- “My boss couldn’t understand how it worked, so he ultimately vetoed it.”
- “My colleague recommended something easier to use.”
While all this is good information, it’s easy to misunderstand what someone is really saying to the untrained eye. Here’s how we could “theme” those answers into two buckets.
| Wanted a specific feature | Found a competitor easier |
| “I felt like your product was a little too simple for the number of tasks I need it to perform” “I couldn’t perform a vital function in your product” | “The other product was simple to set up, that made the difference for me.” “My boss couldn’t understand how it worked, and so he ultimately vetoed it.” “My colleague recommended something easier to use”. “I didn’t find a feature I was looking for despite it being advertised in the demo call.” |
Now that we’ve got our theme buckets, it’s easy for someone to see at a glance that the primary reason for this sample choosing a competitor is ‘ease of use’. This insight could have been easily misinterpreted if the person reading your report was scanning the quotes.
To take themes a step further, highlight themes that elicited a strong emotional response from interviewees. This can help you prioritize your initiatives from most impactful to “nice to haves.”
3. Break down overall themes into segments
By breaking answers into themes, you can easily assume one answer is more prevalent than the other. But what if everyone you interviewed wasn’t an ideal customer for your company?
Here’s an example to show you how to make sure you get better results from your loss analysis report:
You interview 30 random people that were lost in the sales process of an invoicing company for SMBs. Of those 30 people, 22 didn’t choose you because you lacked a specific feature. On the other hand, 8 went with a competitor product that they found easier to understand.

An easy conclusion is that you should build new features pronto. But what if we separated those responses into our ideal target audience (SMBs) and those who aren’t a good fit (solopreneurs)?
It’s the SMBs we want to attract the most.

Suddenly we can see our ideal SMB customers are overwhelmingly choosing our competitors because they think they are easier (and our product is harder).
The result: Rather than being distracted by building new features, we can confidently tell our teams that usability and ease of use are top priorities.
It’s not simply the majority of customers but rather the majority of best-fit customers that should sway your findings.
4. Add in your actionable recommendations and next steps
By now, your win-loss report is nearly finished. It’s a powerhouse document that can help align your product marketer, sales team, and leadership.
Alone, recommendations are helpful and can get the ball rolling in the right direction. But creating a clear project plan or setting a date for a follow-up meeting can be so much more powerful than just saying, “any questions?” and hearing crickets in return.
Avoiding False Starts in Your Win-Loss Project
Here’s how to ensure your win-loss report meeting doesn’t flop.
When you help guide the process forward, progress is inevitable.
To take your report from good to great, make it easy for your colleagues to take the next step by suggesting the following:
- New project timelines
- Follow-up meetings
- Priority tasks
Learn more about win-loss reports
To recap, the four vital things to include in your win-loss reports are statistics, themes, segmentation, and actionable recommendations. With those, no one can deny the efficacy and importance of win-loss research to your growth goals.
Goldpan is a consultancy providing a win-loss analysis service to companies and sales leaders worldwide who want to understand what’s working and what’s not so they can maximize sales opportunities. If you’d like to chat about your upcoming project, get in touch here.